The green building industry is seeing continued growth. That’s affecting higher education as colleges build new or retrofit old facilities, and as they prepare students for the green workforce.
Ryan O’Neill, associate director for client solutions at the U.S. Green Building Council (USGBC), provides insight about trends, tariffs, training and more.
What trends are you seeing in green building, particularly in the higher education sector?
Ryan O’Neill
We are seeing continued growth of green building and LEED certification within the higher education sector. This appears to be driven by a few factors, including student interest in attending schools committed to sustainability, college and university net zero or decarbonization goals, and the cost efficiency of high-performing buildings, allowing institutions to save money on operations. With green building’s unique ability to support each of these factors, it is no surprise the market continues to increase.
What does it mean to have a LEED-certified building and why is that something to strive for?
LEED, or Leadership in Energy & Environmental Design, is a globally recognized symbol of excellence in green building. The core of a LEED-certified building undergoes a third-party review to ensure cost savings, lower carbon emissions and a healthier environment for the places we live, work and learn. LEED’s global sustainability agenda is designed to achieve high performance in key areas of human and environmental health, acting on the triple bottom line — putting people, planet and profit first.
If a college can’t afford to build an entirely new building, are there ways to retrofit or remodel current buildings to make them more green (and provide cost savings)?
This is a very common concern for many colleges and universities. We have programs for all building types and phases, including new construction, major renovations, commercial fit outs, existing buildings and more. However, the two most applicable offerings for the situation described would be LEED Existing Building Operations and Maintenance at the individual building level or PERFORM at the portfolio level.
The LEED for Building Operations and Maintenance (O+M) standard emphasizes performance strategies and outcomes by improving building operations and policies. This can allow for substantial improvements to be made to existing buildings at minimal cost. This provides better energy efficiency along with the associated cost savings and extends the usable life of the building.
PERFORM is a new offering developed to support sustainability planning, analysis, improvement and performance verification at the real estate portfolio scale. While many organizations have ambitious sustainability targets, there is an overall lack of tools and resources to drive performance improvement and validation across their portfolios. PERFORM assists organizations and portfolios in setting goals, measuring progress towards their goals and obtaining third-party certification to verify these impacts.
Will tariffs impact the cost to build green?
Like many other industries, tariffs and potential tax changes will impact the real estate and construction industry as a whole. Despite the current challenges, we continue to see momentum for green buildings to grow and are seeing indicators that organizations that have incorporated better buildings in their business plan are sticking with it. For example, states and localities across the U.S. continue working toward better buildings, as is the higher education sector. They see the benefits of high-performing buildings, including lower utility costs, occupant comfort and higher property value. Additionally, many are seeing how green buildings are incentivized through programs that offer attractive funding options for LEED-certified projects.
Community colleges often are training current and future construction workers, electricians, HVAC technicians and others needed in the building industry. What are some of the special skills these workers should have to be prepared for green building?
The training and education of incoming professionals is of the utmost importance. While there are many needed skills, a first step would be understanding how their trade impacts the whole project. A successful project needs all trades to work in concert for the best outcome. LEED v4 added a credit for the integrative process, and LEED v5 has doubled down, expanding this category to include four new prerequisites. These credits and prerequisites focus on a collaborative approach, including all stakeholders in the early phases of a project’s design, ensuring positive outcomes and limiting issues that could otherwise not be found until later in the process.
Credentials are also helpful in validating a professional’s field expertise. LEED credential denotes proficiency in sustainable design, construction and operations standards. More than 203,000 professionals have earned a LEED credential to help advance their careers, showcasing knowledge, experience and credibility in the green building marketplace.
Real-world experience and skill development are also critical to career development. Recognizing this need, the USGBC supports upcoming professionals by offering programs such as LEED Labs. This program is a partnership between the USGBC and academic institutions to provide a multidisciplinary immersion course utilizing project-based learning to educate students within a real-world project. As an added benefit, students enrolled in LEED Lab will be prepared to sit for the LEED AP credentialing exam and will have access to discounted pricing.
The future is happening right now in cities around the world, where artificial intelligence has moved far beyond science fiction and into the daily operations that keep millions of people moving, safe, and connected. From traffic lights that think for themselves to energy grids that predict tomorrow’s needs, AI has quietly become the invisible brain running some of the world’s most advanced urban centers.
These aren’t just cities with a few smart features tacked on – they’re places where AI systems make thousands of decisions every hour, learning and adapting to create better lives for residents. Here is a list of 17 smart cities where AI is taking over everything from morning commutes to emergency response.
Singapore
DepositPhotos
Singapore leads the pack with its Smart Nation initiative, where AI has become the central nervous system for nearly every urban function. The city-state uses AI-driven traffic systems that dynamically adjust signals based on real-time conditions, resulting in a 92% reduction in crowded bus services and cutting waiting times by 3-7 minutes.
The government invested $1.73 billion in this transformation, creating digital platforms that use AI for everything from healthcare monitoring with wearable IoT devices to autonomous transport systems. Singapore’s AI integration runs so deep that the city operates like a massive, coordinated machine where every component talks to every other component.
Barcelona
DepositPhotos
Barcelona has turned AI into an art form, with the city operating more like a living organism that responds intelligently to its environment. The Spanish city uses AI-powered traffic lights that adapt to real-time conditions, cutting traffic congestion by 30% and dramatically reducing travel times.
Its Sentilo system deploys AI to monitor sensor networks that detect everything from potential fires to flood risks, allowing officials to respond before emergencies escalate. The city’s AI employment platform attracted over 73,000 people in 2024 by matching workers to jobs using intelligent algorithms.
Amsterdam pioneered the smart city movement back in 2009 and now operates over 170 AI-enhanced projects throughout the city. The Dutch capital stands out for its ethical approach, developing a comprehensive AI framework that emphasizes transparency and citizen participation in every algorithmic decision.
AI manages the city’s energy-efficient systems, from smart street lighting that adjusts based on pedestrian traffic to renewable energy distribution for electric vehicles. Amsterdam’s approach proves that AI can be both powerful and responsible, with algorithms that actively work to reduce inequality rather than amplify it.
Dubai
DepositPhotos
Dubai’s AI ambitions read like something from a futuristic movie, with plans to make the city ‘the happiest place on Earth’ through technological innovation. The emirate’s AI Roadmap aims to make 25% of all journeys autonomous by 2030, with AI already managing driverless taxis and delivery robots navigating city streets.
Smart streetlights equipped with sensors monitor traffic, air quality, and public safety while optimizing energy consumption. Dubai’s police force employs AI algorithms for predictive crime prevention, while the healthcare sector uses AI for diagnostics and personalized medicine.
Tokyo
DepositPhotos
Tokyo faces unique challenges managing over 37 million residents while dealing with constant natural disaster threats, making AI absolutely essential for survival. The Japanese capital employs AI to analyze seismic data and predict earthquake impacts, enabling rapid emergency responses that can save thousands of lives.
AI-driven traffic management systems help navigate the city’s notorious congestion, while predictive maintenance systems prevent public transport failures before they happen. The city’s AI integration extends to monitoring critical infrastructure like bridges and tunnels, detecting wear and tear before accidents occur.
Helsinki has embraced AI as a tool for creating transparency and citizen engagement, using open data principles to let residents and businesses make better decisions. The Finnish capital uses AI to predict and manage hospital patient flows, ensuring resources get allocated efficiently and people receive timely care.
Environmental monitoring systems powered by AI help the city track air quality and other factors in real-time. The city’s commitment to becoming carbon-neutral by 2035 relies heavily on AI optimization of energy systems and transportation networks.
Hong Kong
DepositPhotos
Hong Kong demonstrates how AI can manage incredible density and complexity, with intelligent systems handling everything from immigration processing to disaster preparedness. The city’s Electronic Health Record Sharing System uses AI to manage and analyze patient data across healthcare providers, while facial recognition and license plate detection assist law enforcement efforts.
AI-driven public transportation systems use predictive analytics to optimize schedules and reduce crowding. The city collects real-time traffic data across 80% of major routes, using AI to reduce congestion and improve flow.
Seoul
DepositPhotos
Seoul has created one of the world’s most connected cities, with AI systems that seem to anticipate residents’ needs before they even realize them. The Korean capital operates an AI-powered public transport system using smart cameras in subways to monitor passenger volumes and adjust train frequency in real-time.
The city installed 50,000 IoT sensors across infrastructure, with AI analyzing data from bridges, roads, and buildings to prevent failures. Seoul’s ‘AI detective’ system analyzes crime patterns to predict and prevent incidents, while the world’s fastest internet speeds enable real-time AI processing throughout the city.
London leverages AI to manage one of the world’s most complex urban environments, with intelligent systems handling everything from healthcare to transportation. The city’s Transport for London uses AI-enabled cameras at Underground barriers to optimize passenger flow, increasing throughput by 30% and reducing queue times by up to 90%.
AI-powered digital twins monitor the entire underground system, revealing hidden problems and optimizing operations. The British capital employs AI extensively in healthcare, using algorithms to improve patient care and resource allocation.
Copenhagen
DepositPhotos
Copenhagen’s race to become carbon-neutral by 2025 relies heavily on AI systems that optimize every aspect of energy use and transportation. The Danish capital uses smart grid technologies powered by AI to manage renewable energy distribution, while intelligent traffic systems prioritize bicycles and public transport over cars.
AI algorithms help manage the city’s famous district heating system, using waste heat from power plants to warm homes efficiently. Siemens technology enables AI-powered train systems that will eventually operate completely autonomously, creating what will become the world’s largest automatic urban railway.
Zurich
DepositPhotos
Zurich combines financial precision with environmental consciousness through AI systems that optimize energy use and transportation throughout the Swiss city. Smart energy management powered by AI helps coordinate renewable energy sources with storage systems, while intelligent recycling systems use algorithms to minimize waste.
The city’s AI-driven transportation network reduces pollution while maintaining Switzerland’s reputation for efficiency. Green technology integration throughout Zurich uses AI to monitor and adjust building energy consumption, contributing to the city’s position among the world’s most sustainable urban centers.
New York City operates hundreds of smart sensors and AI technologies through pilot programs that started in 2020, gradually transforming how the massive metropolis manages its complexity. AI systems help coordinate traffic flow across the city’s grid system, while predictive analytics assist with everything from emergency response to resource allocation.
The city’s sheer scale makes AI essential for managing services that affect over 8 million residents. Smart city technologies deployed throughout the five boroughs collect and analyze data on public safety, transportation, and environmental conditions.
Los Angeles
DepositPhotos
Los Angeles has turned to AI to solve its legendary traffic problems, implementing predictive traffic management systems that anticipate bottlenecks and reroute vehicles before delays occur. The sprawling city’s AI-powered systems have improved travel times by 12-16% in some areas while reducing emissions from congestion by 3%.
Smart traffic signals adapt to real-time conditions throughout the metro area. The city’s AI integration extends beyond transportation to energy management and public safety, with algorithms helping coordinate services across a region that spans multiple counties.
San Francisco
DepositPhotos
San Francisco uses AI to enhance its power grid efficiency, with algorithms analyzing smart meter data to predict energy demand and optimize electricity distribution. The city’s AI systems also manage water supply monitoring and usage optimization, ensuring efficient resource management in drought-prone California.
Smart transportation systems help coordinate public transit and emerging autonomous vehicle testing. The tech capital’s approach to AI in city services reflects its position at the center of innovation, with cutting-edge applications that often become models for other cities worldwide.
Shanghai employs AI for comprehensive energy management, with intelligent systems coordinating power generation, storage, and distribution across one of the world’s largest cities. The Chinese metropolis operates AI-powered autonomous bus systems that use deep learning to optimize routes and reduce travel times by 20%.
Smart city sensors throughout Shanghai monitor air quality and traffic flow continuously. The city’s AI integration supports massive population density through predictive maintenance of infrastructure and intelligent resource allocation.
Buenos Aires
DepositPhotos
Buenos Aires pioneered AI in citizen services with its chatbot ‘Boti,’ launched in 2019 and now handling millions of conversations annually. The Argentine capital’s AI assistant has evolved alongside generative AI technology, becoming residents’ preferred channel for accessing government services.
AI algorithms help manage the city’s complex transportation network and optimize public service delivery. The city demonstrates how AI can improve government responsiveness and citizen engagement, even in developing economies with limited resources.
Beijing
DepositPhotos
Beijing showcases China’s comprehensive approach to AI integration, with the Beijing Citizen Social Service Card using intelligent systems to streamline access to public services. The Chinese capital employs AI extensively in transportation management, environmental monitoring, and public safety systems.
Smart city technologies help manage air quality and traffic flow in one of the world’s most populous urban areas. The city’s AI integration reflects China’s broader push toward intelligent urban management, with systems that coordinate everything from waste management to emergency response.
These 17 cities represent the beginning of a fundamental shift in how humans organize themselves in urban spaces. AI hasn’t just been added to existing city infrastructure – it has become the operating system that makes modern urban life possible.
From Singapore’s comprehensive Smart Nation to Buenos Aires’ citizen-focused chatbots, these cities prove that artificial intelligence isn’t taking over in some dystopian sense, but rather stepping up to solve problems that human administrators simply cannot handle at the speed and scale required. The future of urban living is already here, and it thinks faster than we do.
Urban life is transforming faster than ever. Across the globe, cities are becoming smarter, powered by real-time data, connected infrastructure, and integrated digital platforms that aim to solve long-standing problems like congestion, pollution, energy waste, and inefficient public services. This isn’t just about faster internet or more surveillance cameras. The rise of smart cities represents a shift in how urban areas are designed, managed, and experienced by everyday people.
At the heart of the smart city movement is a simple but powerful idea: when systems talk to each other, and when cities learn from data in real time, urban life becomes more efficient, more sustainable, and more livable. Solutions like automated mailroom management platforms are small but essential pieces in this growing ecosystem.
Defining the Smart City
Smart cities use technology to improve city services, streamline operations, and enhance the quality of life. Sensors, IoT devices, artificial intelligence, and machine learning are deployed to monitor everything from air quality and water usage to traffic flows and emergency services.
The result is a responsive urban environment that adapts to its residents’ needs instead of forcing people to adapt to outdated infrastructure.
What sets smart cities apart is their ability to integrate multiple domains, transportation, energy, governance, communications, and safety into a unified system. Rather than siloed departments managing each service independently, data flows between systems, giving city planners and administrators a clearer picture of what’s happening and what needs attention.
Urban Mobility Is Going Digital
Transportation is often the first domain where smart city technology becomes visible to citizens. Smart traffic lights, ride-sharing platforms, electric scooters, and predictive route mapping are changing how people move through cities.
Some of the most advanced cities are using AI to adjust traffic signals based on congestion patterns in real time. Others use data from mobile apps to improve bus and train schedules based on actual usage rather than fixed timetables. Intelligent parking systems can guide drivers directly to open spaces, cutting down on traffic and emissions.
For residents, the goal is convenience. For cities, it’s sustainability.
Benefits of intelligent mobility systems:
Reduces traffic congestion and travel time
Supports cleaner transport alternatives
Enhances pedestrian and cyclist safety
Makes public transit more accessible and reliable
Smart mobility doesn’t just ease commutes. It’s also a key strategy in reducing greenhouse gas emissions and making cities healthier.
Energy Efficiency at Urban Scale
Another central goal of smart cities is to reduce energy consumption and carbon output. Smart grids allow energy providers to balance supply and demand dynamically, reducing waste and lowering costs. Buildings equipped with connected sensors can adjust heating, lighting, and cooling based on occupancy and time of day.
Cities like Amsterdam and Singapore have adopted citywide energy dashboards that track consumption trends and help both the public and private sectors meet sustainability targets. These technologies also empower individuals to manage their own energy use through apps and smart home integrations.
The smart city model moves energy efficiency from an individual concern to a collective solution.
Digital Governance and Civic Engagement
Beyond infrastructure, smart cities are also changing how governments interact with residents. From mobile apps that let citizens report potholes or request services, to open data dashboards that share city performance metrics, digital governance tools are building transparency and trust.
City administrators are adopting platforms that enable participatory budgeting, digital voting, and public feedback on urban development plans. These systems make government feel more immediate and accessible, especially to younger, digitally native populations.
For smart cities to succeed, technology must serve citizens, not just bureaucracies. The goal is to create a two-way relationship where residents are not just consumers of services, but contributors to how cities evolve.
Smarter Spaces for Growing Populations
As urban populations grow, managing shared spaces efficiently becomes a critical issue. Smart building technologies are enabling better control of office occupancy, lighting, and air quality. In residential and mixed-use buildings, digital access systems are reducing friction for tenants and improving safety.
One often-overlooked challenge is the increasing volume of deliveries in apartment complexes, universities, and office buildings. E-commerce has turned mailrooms into logistical choke points. Forward-thinking developments are adopting software that supports streamlined parcel operations to automate the logging, notification, and pickup process for incoming packages.
When integrated with other building systems, these tools provide more than just convenience:
Reduce congestion and waiting times at mailrooms
Increase security and accountability for delivered items
Free up administrative staff to focus on tenant service
Offer digital records for auditing and analytics
Smart parcel management tools also reduce resource waste. Buildings that use structured delivery systems have fewer lost packages, lower reshipping rates, and better sustainability outcomes by cutting down duplicate deliveries.
To see how this works in practice, this short video offers a real-world look at how smarter parcel workflows contribute to better building operations in smart cities.
Data Privacy and Ethical Design
The rise of smart cities isn’t without concerns. As more data is collected from traffic sensors, utility meters, and personal devices, the need for strict privacy protections becomes critical. Citizens must know what data is being gathered, how it is used, and how it is protected.
Cities leading the way in ethical smart design are building privacy and equity into their frameworks from the beginning. That includes:
Publishing clear data governance policies
Minimizing surveillance and facial recognition use
Offering opt-in rather than mandatory systems
Including community voices in planning and procurement decisions
Technology should support human needs, not override them. The most successful smart cities will be those that prioritize equity and ethics alongside innovation.
What the Future Holds
Smart cities are not a distant future vision. They are already here-in various stages of development, reshaping how we interact with our neighborhoods, services, and governments. From AI-managed intersections to digitized civic engagement, these technologies are quietly but profoundly changing urban life.
As infrastructure becomes more connected, cities will be able to respond faster to challenges, plan more intelligently, and create more inclusive experiences for all residents.
The next step will be expanding access to these innovations beyond capital cities and wealthy urban cores. Truly smart cities are ones that work for everyone, not just those in the most connected districts.
Final Thought
The rise of smart cities isn’t about cities getting more digital for the sake of it. It’s about creating places that are safer, cleaner, more efficient, and more responsive to the people who live in them. Whether it’s reimagining how we commute, how we manage buildings, or how we engage with public institutions, the goal is a better urban life. The smart city is not just about sensors and screens, it’s about smarter systems that make room for human needs.
My commitment to sustainability in construction began in 2004—long before the word became a global priority. At the time, my concern was a straightforward yet pressing one: the relentless depletion of natural resources used in producing construction materials. What began as a narrow focus soon evolved into a much broader mission—one that now encompasses reducing pollution, minimising waste, and rethinking the way we design, build, and ultimately live.
The UN SDGs as a Guiding Framework
The United Nations Sustainable Development Goals (SDGs) provide a global blueprint for addressing humanity’s most urgent challenges by 2030, and engineering sits at the heart of that vision. Civil engineering in particular plays a decisive role in shaping a sustainable world:
SDG 11 (Sustainable Cities and Communities): by creating resilient urban infrastructure, efficient water systems, and sustainable waste management practices.
SDG 12 (Responsible Consumption and Production): by promoting reuse, recycling, and circular economy models that break the cycle of overconsumption.
SDG 14 (Life Below Water): by addressing sources of plastic pollution before they reach our oceans.
As civil engineers, we hold the tools to turn these goals from aspirations into tangible outcomes.
Turning Ideas into Action
As awareness grows around the environmental cost of unchecked consumption, a fundamental question emerges: How can we build and live without exhausting the resources we depend on?
One project that stands out in my journey explored exactly this challenge. Together with a group of civil and chemical engineering students, we investigated ways to repurpose plastic waste in concrete production. By blending polymers into an alternative fine aggregate, we produced a concrete mix that, while 60% lower in compressive strength than traditional mixes, still met the requirements for non-structural applications. Interestingly, the density of the mix was reduced by 16%, making it lighter and well-suited for prefabricated elements. This innovation not only diverted plastic from landfills and waterways but also reframed waste as a valuable resource.
Collaboration with academics at other universities has reinforced my commitment to eco-friendly construction materials. Recent projects have examined the use of recycled aggregates from demolition sites, as well as industrial by-products such as fly ash and slag, in concrete production. These approaches reduce the strain on natural resources while lowering the carbon footprint of cement manufacturing—one of the world’s largest contributors to emissions.
In parallel, research into life cycle assessments (LCAs) of buildings has deepened my focus on sustainability. LCAs encourage us to evaluate every stage of the construction process, from design through demolition, and make more informed choices along the way. At EIT, we are currently supervising doctoral students investigating the use of Bayer bauxite waste (red mud) as a potential cement replacement—another step toward turning environmental liabilities into assets.
Engineering has always been about solving problems. But today, it must also be about creating opportunities—opportunities to rethink materials, systems, and the very models that underpin our industries. Moving away from a linear “take–make–dispose” approach and embracing a circular economy allows us to transform waste into value, reduce environmental impacts, and align economic growth with ecological resilience.
The real challenge now is to inspire the next generation of engineers to see sustainability not as an add-on, but as a guiding principle. Every material, process, and design decision must be viewed through the lens of long-term environmental stewardship. The solutions we need already exist; our task is to apply them, refine them, and scale them up.
Ultimately, we can always choose to be kinder to the planet. As engineers, we have both the privilege and the responsibility to make that choice matter—and to ensure that our work contributes not just to the built environment, but to the health and future of the natural world.
Dr. Ana Evangelista is a Civil Engineer with over 20 years of academic and industry experience. She is currently a Course Coordinator and Lecturer in Civil Engineering at the Engineering Institute of Technology (EIT), where she also contributes to the Academic Board and coordinates the Work Integrated Learning program. Her research, including a PhD on non-destructive testing of concrete, has been published internationally, and she has extensive experience in teaching, consultancy, and research in civil engineering.
KEYNOTE INTERVIEW: How can we reconstruct sites targeted by urbicide?
Urbanization › KEYNOTE INTERVIEW: How can we rebuild in areas hit by urbicide?
Salma Samar Damluji, an architect and trustee of the Earth Architecture Lab in London, has been working for over thirty years in the Middle East and war inflicted cities in Yemen. She is co-founder of the Dawan Mud Brick Architecture Foundation and a member of the jury of the Global Award for Sustainable Architecture™.
Salma Samar Damluji, architect and trustee of the Earth Architecture Lab in London, has worked on sites in Yemen inflicted by urbicide, the violent and systematic destruction of cities. Her vision for reconstruction is inspired by the culture of earth architecture driven by sustainability. How can we draw on local know-how to recover the destroyed landmarks and fabric of cities? How can we create projects that respond to environmental threats and challenges, and are firmly rooted in our times? She provides the answers in this keynote interview.
Faced with the destruction of cities and infrastructure in the Middle East, what are the first steps to be taken to initiate resilient reconstruction?
The destruction of cities initially targets infrastructure, to paralyze the operation of electricity, sewage and water networks and services. Essentially the main target is the historic fabric and monuments, to destroy the cultural heritage of the place.
In this context, the first step in reconstruction is resilience: identify and assess the extent and quality of the damage. Once this has been evaluated, we implement emergency and safety measures, since bombed or collapse buildings are dangerous and at high risk of collapse. Clear away the rubble and sort the materials for recycling. Sometimes a structure is so fragile and precarious that it cannot be restored and must be pulled down before rebuilding.
For example, at the Quʿaiti Sultan’s Palace in Al Qatin (Yemen), where all the ceilings had collapsed after successive seasonal rain floods, when we started working in 2022 it took four months to clear the rubble, consolidate the structure, install shoring and scaffolding to stabilize the damaged structure and remaining ceilings before reconstruction and restoration could be considered. Safety measures like this require a specialized team of master builders. The renovation work, that continued after 2024, is also based on local techniques using sun-dried mud-brick construction and lime damp proofing. Resilience is achieved by drawing on local know-how of the master builders and craftsmen including communities in the rebuilding recovery process.
Resilience is achieved by drawing on local know-how and including communities in the reconstruction process.
Given the urgency, is it possible to rebuild quickly while maintaining a sustainable approach?
Yes, if we rely on local resources and methods. In different regions, I’ve seen how natural materials such as earth, stone, shale and bricks can facilitate recycling and efficient reconstruction. In Siwa, Egypt, bricks made from salt mud are used, perfectly suited to the arid climate of the oasis. In Yemen, depending on the region, we use stone, rammed earth or mudbricks. In the High Atlas Mountains of Morocco, the kasbahs are built of rammed earth, and in Algeria the same technique is used in building the ksour in the Sahara. These techniques are the legacy of a heritage shared through the ancient trade caravan routes. The great trade routes that crossed the desert, linking Arabia, North Africa via Egypt, and enabled the exchange and circulation of goods while also spreading ideas, architectural knowledge and techniques.
The right solution for sustainable construction is always to start with the region, its resources, its know-how and its environment, which also needs to be entirely rebuilt.
Aït Benhaddou, Morocco. An iconic example of earth architecture, this UNESCO-listed fortified town embodies the passing on of vernacular know-how and the adaptation of housing to the arid conditions of the High Atlas Mountains. A model of sustainability that today inspires reconstruction and new projects that respect the land and its resources.
Can traditional techniques interact with modern innovations?
Yes, this is already happening. As early as the 1950s-1960s in Iraq, modern architects were incorporating local materials and crafts inspired by the vernacular in contemporary architecture projects. Today, innovations including 3D mud-brick printing are introducing new perspectives, but the essential concept remains the accumulated intelligence regarding construction techniques: thick walls, natural ventilation (windcatchers), interior courtyards, etc. In the field, we pass on these techniques in workshops, and to architects. The incorporation of tradition in modernity makes it possible to innovate while ensuring efficiency and sustainability.
Today, innovations such as 3D mud-brick printing are introducing new perspectives.
Can reconstruction be envisaged without taking the surrounding environment into account?
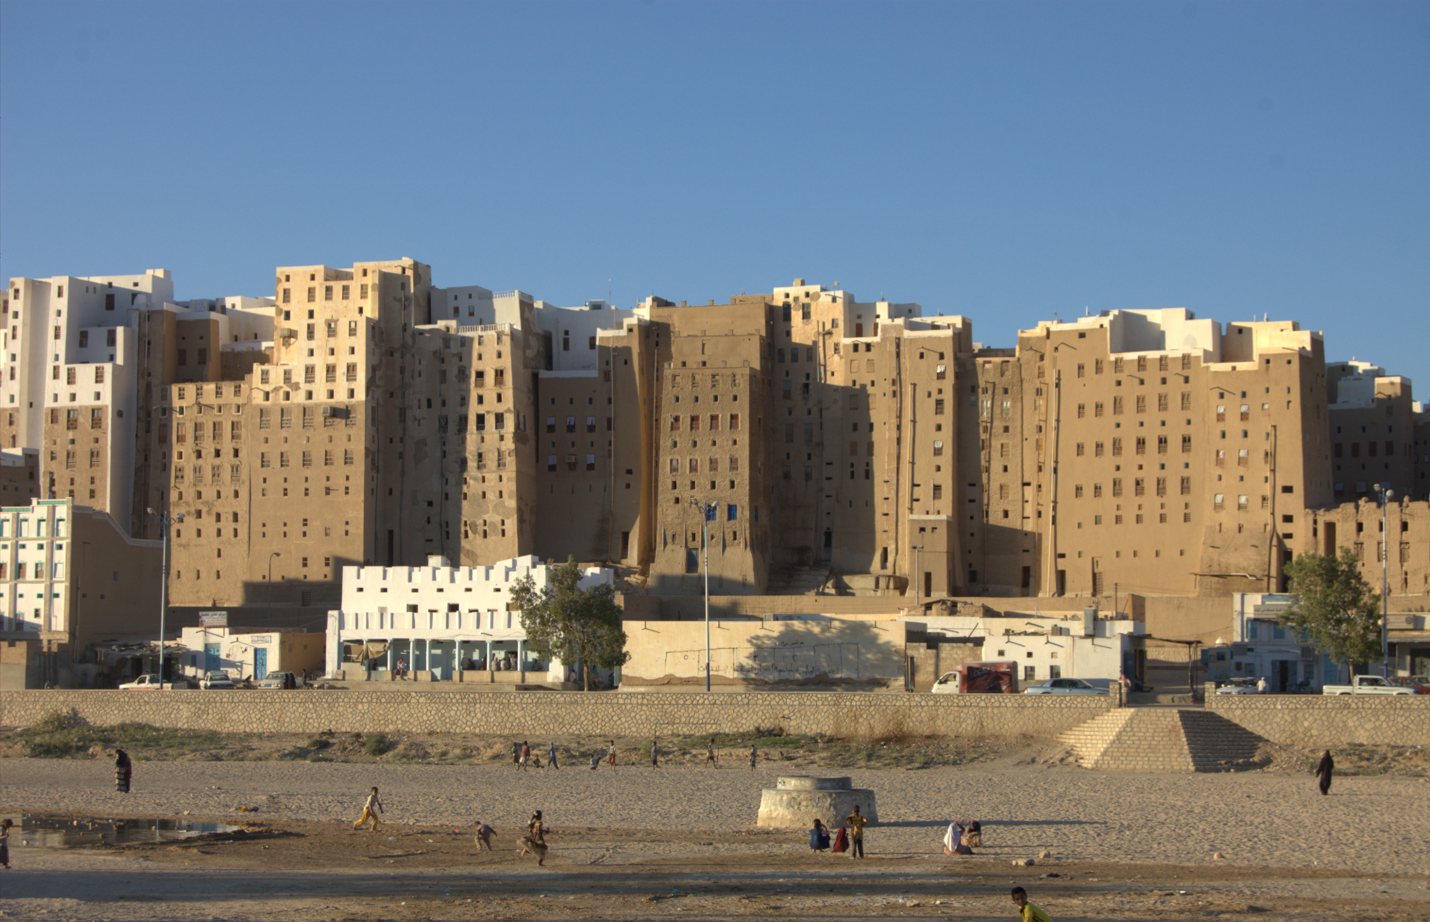
No, because it’s not just lives and towns that are destroyed in war zones, it is also the environment. Farms, agricultural land, parks and gardens are wiped out. In this case, we work with landscape architects and environmental expertise to regenerate the soil as well. Take the example of the city of Shibam in Yemen, a UNESCO World Heritage Site. Earning the sobriquet ‘Manhattan of the Desert’, the city a cluster of tower buildings eight storeys high is evidence of the genius and mastery of using sun dried mud brick. But the city couldn’t exist without the cultivation of the surrounding agriculture, which provides sustainability, climate cover and a balanced ecosystem for the urban fabric and community. I’ve seen in Beirut what happens when the environment is eradicated by wars and exploitation the demise of green and open spaces in favor of real estate speculation has impacted the urban climate irreversibly. Wherever we work, we need to treat and heed the environment before rebuilding a sustainable life for people and nature alike. Architecture on its own is no longer viable or liveable if the surrounding environment is excluded.
Architecture on its own is not viable or livable if the surrounding environment is excluded.
What is the role of the local people in these rehabilitation processes?
Construction is a continuous process, especially when working with the environment. Nothing is put on hold: training residents in local techniques and recycling existing materials is often quicker and more effective than importing industrial solutions. With the Earth Architecture Lab, a London-based foundation I set up in 2021, we’re focused on training young architects to pass on these skills, and techniques to become a real force for rebuilding, even in emergency situations. In Somalia, for example, we are developing designs for housing displaced persons on arid land. These refugee camps are supposed to be temporary but invariably become permanent: we need to go beyond tents or portacabins to offer suitable, dignified accommodation. In this place, there are no facilities for sanitary systems, sewers, access to water and no farming land. Our first step is thus to study how to revive agriculture: any land can be cultivated if water is made available. Our teams work in parallel on water storage, permaculture, sanitation and the design of habitats working with local culture and traditions. It is this approach, centered on training and response to the context, that enables sustainable, rapid and appropriate recovery for the communities in construction.
Training residents in local techniques and recycling existing materials is more efficient and sustainable than importing ready industrial solutions.
We use cookies on our website to give you the most relevant experience by remembering your preferences and repeat visits. By clicking “Accept”, you consent to the use of ALL the cookies.
This website uses cookies to improve your experience while you navigate through the website. Out of these cookies, the cookies that are categorized as necessary are stored on your browser as they are essential for the working of basic functionalities of the website. We also use third-party cookies that help us analyze and understand how you use this website. These cookies will be stored in your browser only with your consent. You also have the option to opt-out of these cookies. But opting out of some of these cookies may have an effect on your browsing experience.
Necessary cookies are absolutely essential for the website to function properly. This category only includes cookies that ensures basic functionalities and security features of the website. These cookies do not store any personal information.
Any cookies that may not be particularly necessary for the website to function and is used specifically to collect user personal data via analytics, ads, other embedded contents are termed as non-necessary cookies. It is mandatory to procure user consent prior to running these cookies on your website.


 Salma Samar Damluji, an architect and trustee of the Earth Architecture Lab in London, has been working for over thirty years in the Middle East and war inflicted cities in Yemen. She is co-founder of the Dawan Mud Brick Architecture Foundation and a member of the jury of the Global Award for Sustainable Architecture™.
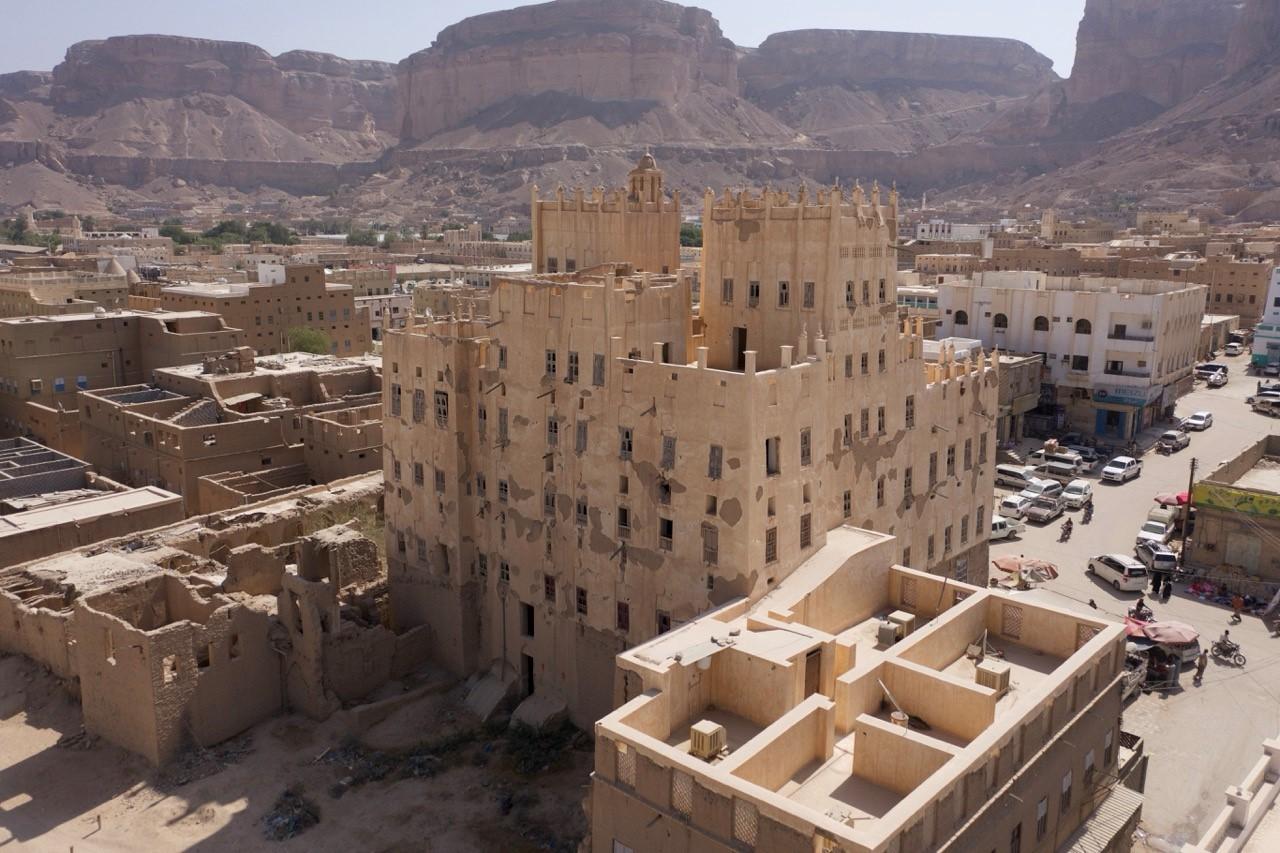


You must be logged in to post a comment.